Returns the currently active component of a tidymatrix object. This can be the matrix itself, the row metadata, or the column metadata, depending on what is currently activated.
Value
The active component:
If "matrix" is active: returns the numeric matrix
If "rows" is active: returns the row_data data.frame
If "columns" is active: returns the col_data data.frame
Examples
mat <- matrix(rnorm(100), nrow = 10, ncol = 10)
row_data <- data.frame(id = 1:10, group = rep(c("A", "B"), each = 5))
tm <- tidymatrix(mat, row_data)

# Extract matrix
tm |>
  activate(matrix) |>
  pull_active()
#>              [,1]       [,2]        [,3]        [,4]       [,5]       [,6]
#>  [1,] -0.22292254 -0.5175954  0.33166312 -0.14514363  0.3230114 -2.3984916
#>  [2,]  0.07796715  0.2695750 -1.24832071  0.39023566  0.3416884 -0.2247779
#>  [3,]  0.33385294  0.1501120  1.81165892  0.58704091  1.2209408 -0.4703124
#>  [4,]  1.26725909 -0.1069665  1.26269989 -0.28637185  1.3367755  0.8689342
#>  [5,]  0.87592738 -1.5415579  0.41937899 -0.49594335  0.7002122 -0.4147590
#>  [6,] -0.30659767  0.1171639 -0.68337631  0.92419964 -1.8116481  1.9764766
#>  [7,] -0.39686877  0.2661815  0.18223052 -0.07202386 -0.4131413  0.4602530
#>  [8,]  0.27018029  2.0298441  0.08801836 -1.05599537 -1.7794081 -1.1332486
#>  [9,] -0.81707999 -2.4100347  0.72125903 -1.39091194  1.1465264 -1.7841149
#> [10,] -1.91789860 -1.0204336 -0.51374795  0.90907112 -0.6853402 -0.3932334
#>             [,7]        [,8]        [,9]      [,10]
#>  [1,] -0.7665398  0.01404361  0.96356659  0.5224026
#>  [2,] -0.3800481 -1.11441740 -0.29604108  0.7219885
#>  [3,]  0.3696684  0.91069665 -1.57050266 -1.1865317
#>  [4,] -0.6247601 -1.71338977 -0.30004881  2.1170135
#>  [5,] -1.4842330 -1.30550967 -0.20971348 -1.3627178
#>  [6,]  1.6193805  1.50723853 -1.13575208 -0.1518297
#>  [7,]  1.7384070  3.13324838  0.24360935 -1.5715362
#>  [8,]  2.4004720  0.11377056  0.09820333 -0.4888412
#>  [9,]  0.7786898  1.85790449  1.52194788  2.1812255
#> [10,] -0.3139165 -1.00675386  1.12956749  0.5080179

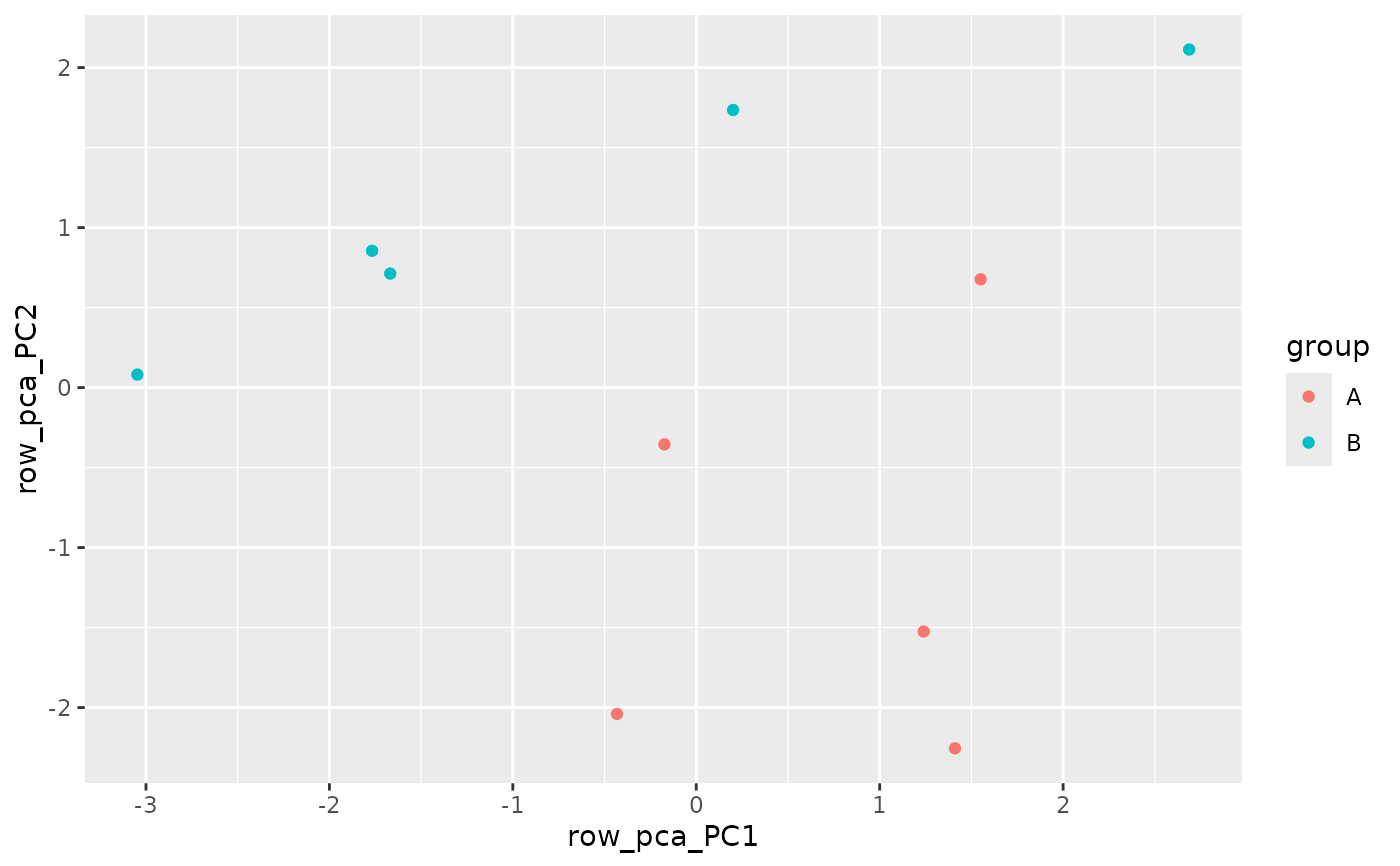
# Extract row metadata, e.g. for plotting
pcs <- tm |>
  activate(rows) |>
  compute_prcomp(center = TRUE, scale. = TRUE) |>
  pull_active()

if (requireNamespace("ggplot2", quietly = TRUE)) {
  library(ggplot2)
  ggplot(pcs, aes(x = row_pca_PC1, y = row_pca_PC2, color = group)) +
    geom_point()
}