Perform Principal Component Analysis on the matrix, adding PC scores to metadata and optionally storing the full prcomp object.
Arguments
- x
A tidymatrix object
- name
Name for this analysis. Default is "row_pca" or "column_pca" depending on active component. Used as prefix for column names.
- n_components
Number of PC components to add to metadata. Default is all components. Use a smaller number for large datasets.
- store
If TRUE, stores the full prcomp object for later retrieval with
get_analysis(). Default is TRUE.- ...
Additional arguments passed to
stats::prcomp(), such ascenter,scale.,tol, etc.
Details
This function wraps stats::prcomp() and passes all additional
parameters directly to it. The PC scores are added as columns to the
active metadata (row_data or col_data).
Examples
mat <- matrix(rnorm(100), nrow = 10, ncol = 10)
row_data <- data.frame(id = 1:10, group = rep(c("A", "B"), each = 5))
col_data <- data.frame(id = 1:10, type = rep(c("x", "y"), 5))
tm <- tidymatrix(mat, row_data, col_data)

# PCA on columns (samples)
tm <- tm |>
  activate(columns) |>
  compute_prcomp(center = TRUE, scale. = TRUE)

# Now col_data has column_pca_PC1, column_pca_PC2, etc.

# Custom name and limited components
tm <- tm |>
  activate(rows) |>
  compute_prcomp(name = "gene_pca", n_components = 3, center = TRUE)

# Get full prcomp object
pca_obj <- get_analysis(tm, "gene_pca")
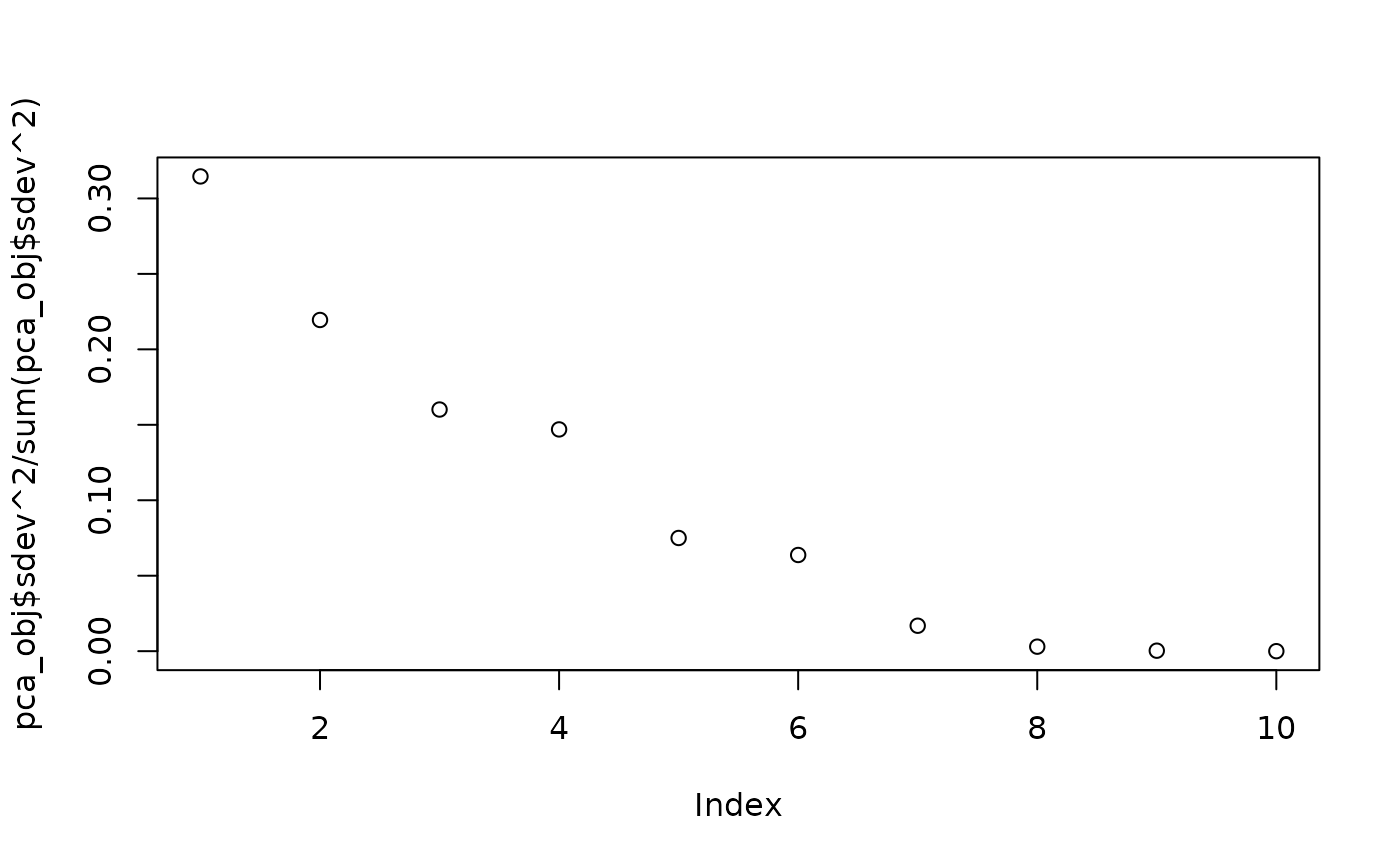
summary(pca_obj)
#> Importance of components:
#>                           PC1    PC2    PC3    PC4    PC5     PC6     PC7
#> Standard deviation     1.7689 1.4775 1.2620 1.2090 0.8638 0.79621 0.40946
#> Proportion of Variance 0.3146 0.2195 0.1601 0.1469 0.0750 0.06373 0.01685
#> Cumulative Proportion  0.3146 0.5340 0.6942 0.8411 0.9161 0.97983 0.99669
#>                            PC8     PC9      PC10
#> Standard deviation     0.17237 0.05673 3.024e-17
#> Proportion of Variance 0.00299 0.00032 0.000e+00
#> Cumulative Proportion  0.99968 1.00000 1.000e+00
plot(pca_obj$sdev^2 / sum(pca_obj$sdev^2))  # Variance explained