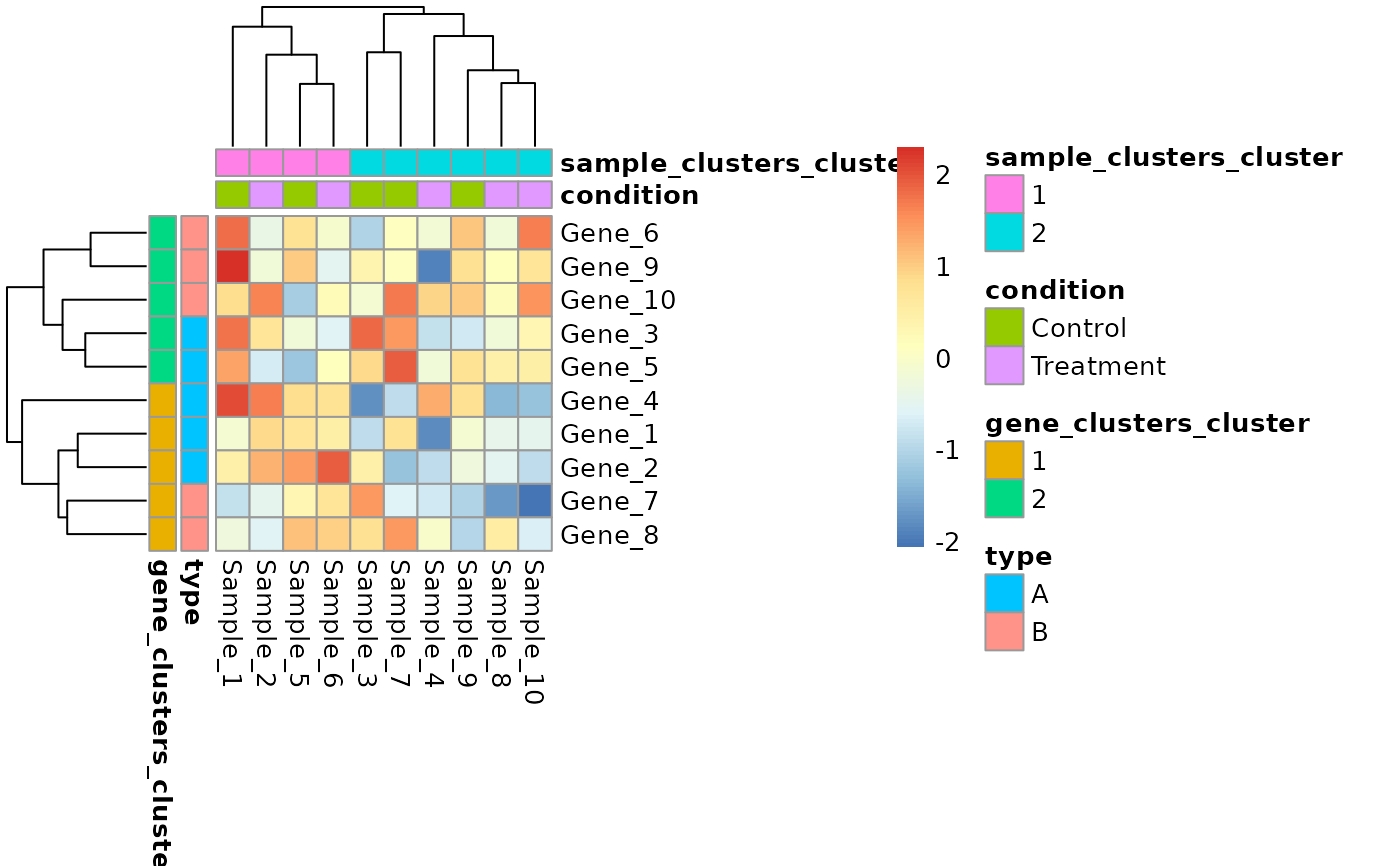
Generate a heatmap using the pheatmap package, automatically using tidymatrix metadata for annotations and stored clustering results.
Usage
plot_pheatmap(
  x,
  row_names = NULL,
  col_names = NULL,
  row_annotation = NULL,
  col_annotation = NULL,
  row_cluster = NULL,
  col_cluster = NULL,
  ...
)
Arguments
- x
A tidymatrix object
- row_names
Column name from row_data to use for row names. If NULL, uses sequential numbers.
- col_names
Column name from col_data to use for column names. If NULL, uses sequential numbers.
- row_annotation
Character vector of column names from row_data to include as row annotations. If NULL, includes all columns except the name column. Set to FALSE to exclude row annotations.
- col_annotation
Character vector of column names from col_data to include as column annotations. If NULL, includes all columns except the name column. Set to FALSE to exclude column annotations.
- row_cluster
Name of stored hclust analysis to use for row clustering, or TRUE to let pheatmap cluster, or FALSE for no clustering, or NULL to auto-detect stored clustering. Default NULL (auto-detect).
- col_cluster
Name of stored hclust analysis to use for column clustering, or TRUE to let pheatmap cluster, or FALSE for no clustering, or NULL to auto-detect stored clustering. Default NULL (auto-detect).
- ...
Additional arguments passed to
pheatmap::pheatmap()
Examples
if (requireNamespace("pheatmap", quietly = TRUE)) {
mat <- matrix(rnorm(100), nrow = 10, ncol = 10)
row_data <- data.frame(
  gene = paste0("Gene_", 1:10),
  type = rep(c("A", "B"), each = 5)
)
col_data <- data.frame(
  sample = paste0("Sample_", 1:10),
  condition = rep(c("Control", "Treatment"), 5)
)
tm <- tidymatrix(mat, row_data, col_data)

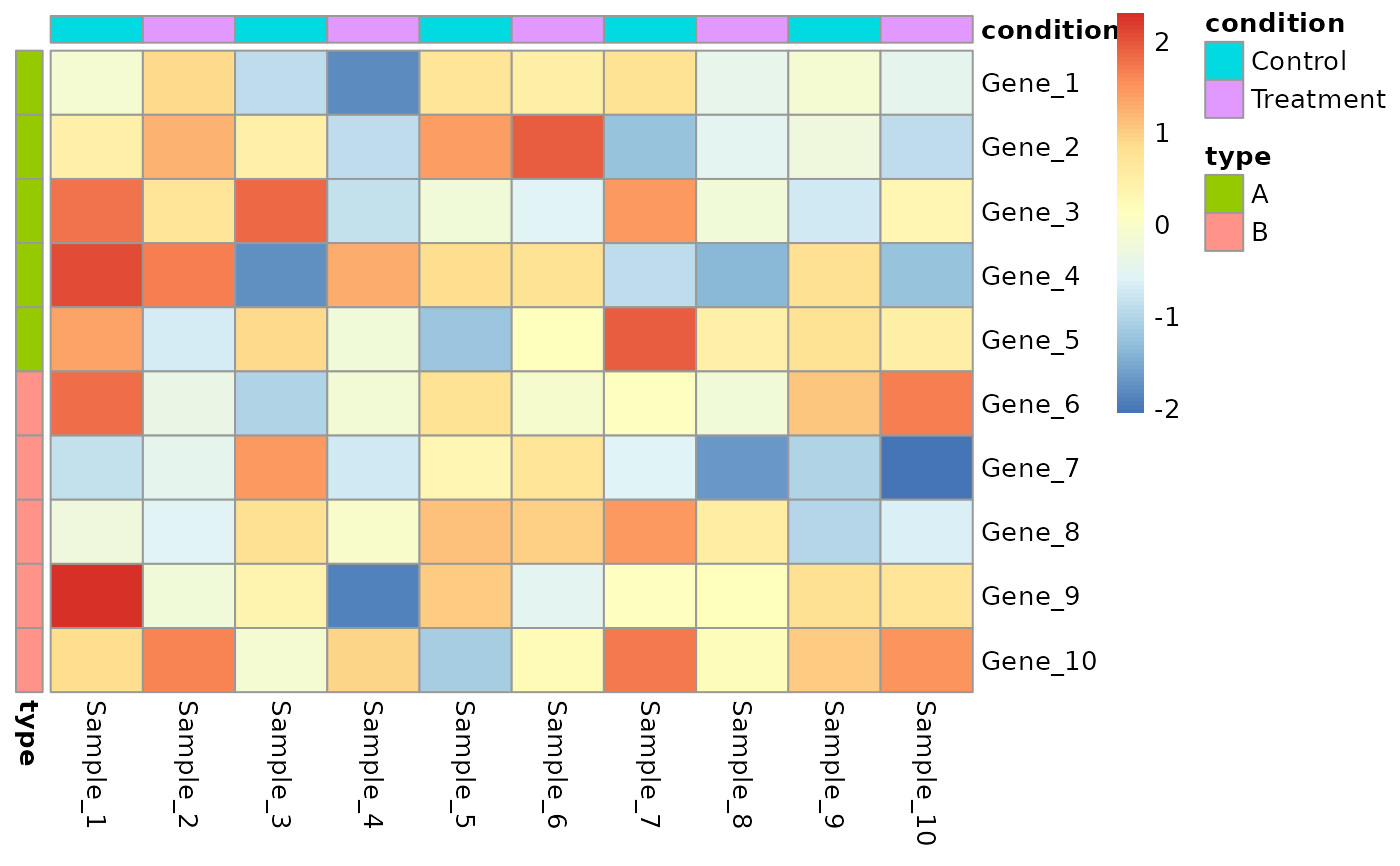
# Basic heatmap (auto-detects stored clustering if available)
plot_pheatmap(tm, row_names = "gene", col_names = "sample")

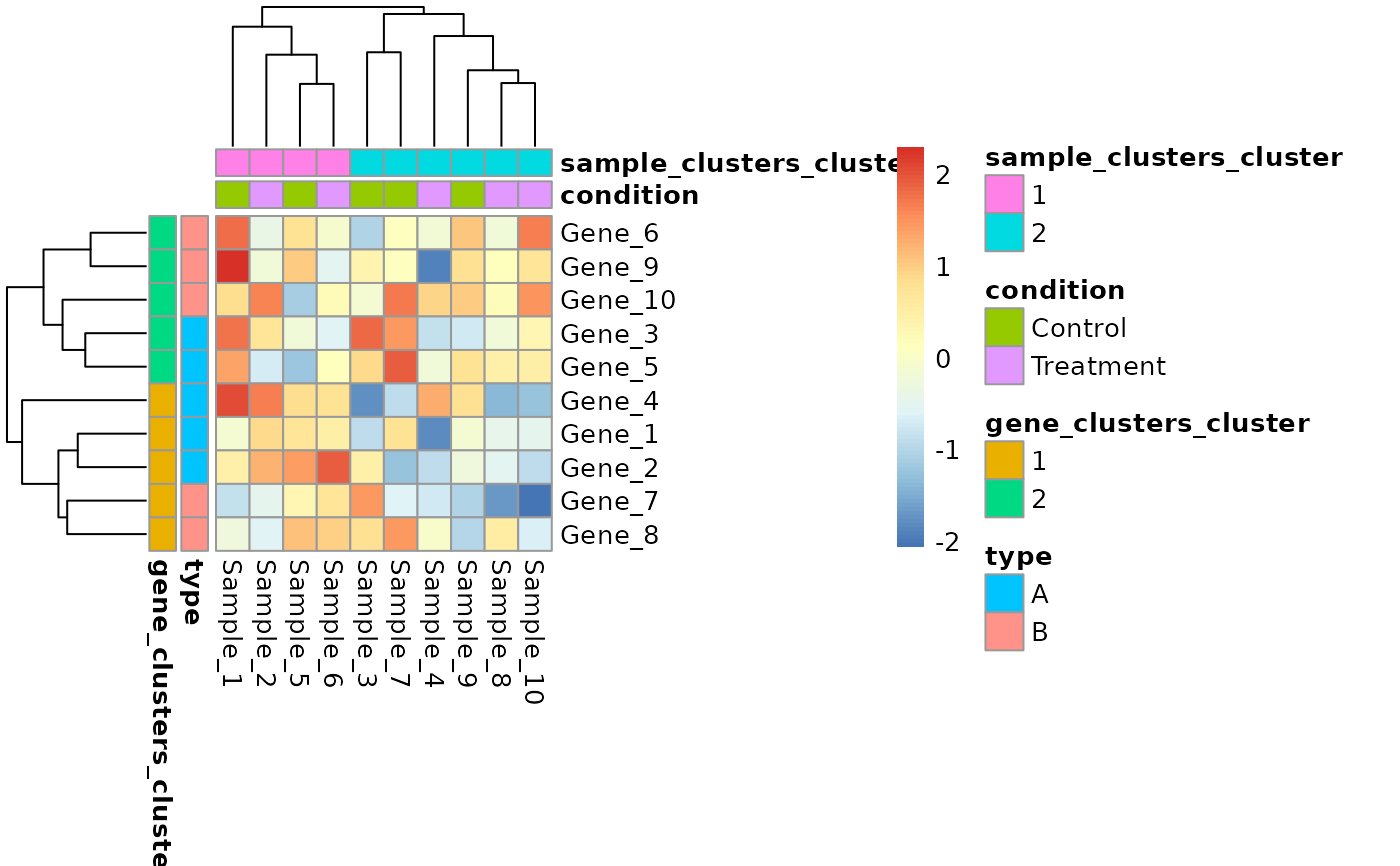
# With stored clustering (auto-detected)
tm <- tm |>
  activate(rows) |>
  compute_hclust(k = 2, name = "gene_clusters") |>
  activate(columns) |>
  compute_hclust(k = 2, name = "sample_clusters")

# Auto-detects and uses gene_clusters and sample_clusters
plot_pheatmap(tm, row_names = "gene", col_names = "sample")

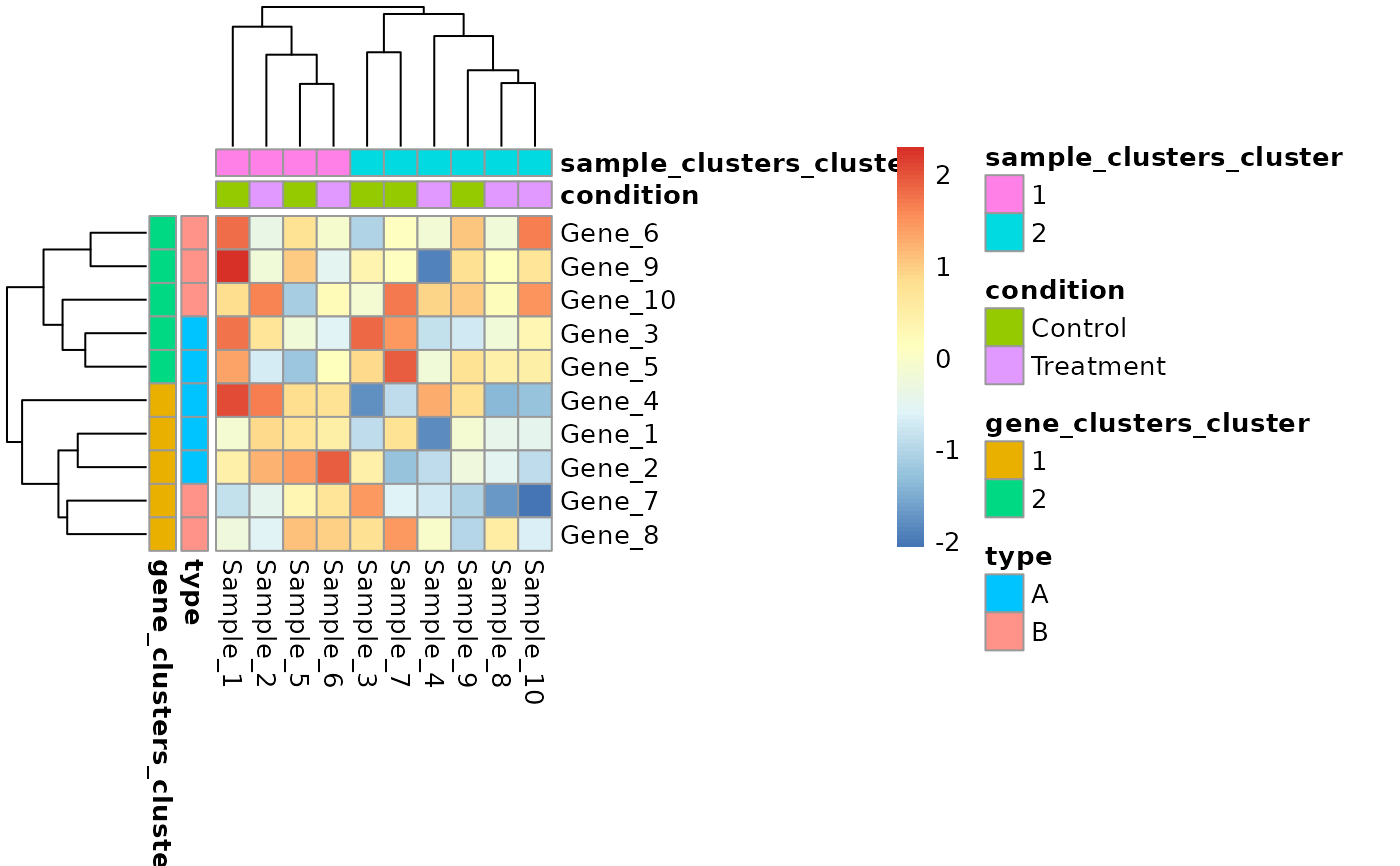
# Explicitly specify which clustering to use
plot_pheatmap(tm,
  row_names = "gene",
  col_names = "sample",
  row_cluster = "gene_clusters",
  col_cluster = "sample_clusters"
)

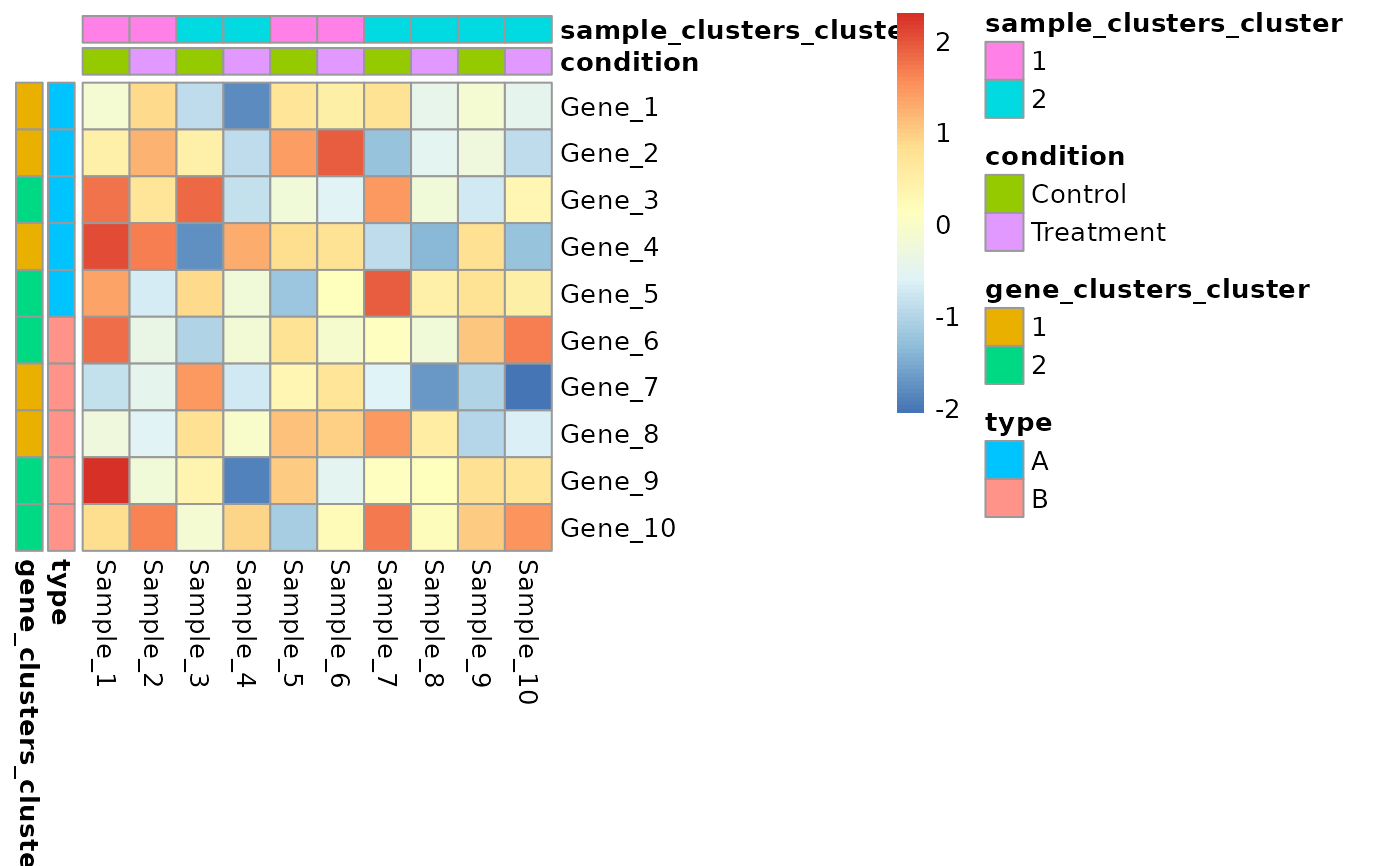
# No clustering (explicit)
plot_pheatmap(tm,
  row_names = "gene",
  col_names = "sample",
  row_cluster = FALSE,
  col_cluster = FALSE
)

# Automatic pheatmap clustering (not using stored)
plot_pheatmap(tm,
  row_names = "gene",
  col_names = "sample",
  row_cluster = TRUE,
  col_cluster = TRUE
)
}