Converts a tidymatrix into a long-format data.frame where each row represents a single matrix cell with its associated row and column metadata. This is useful for plotting individual data points or performing analyses that require long-format data.
Value
A data.frame/tibble with m*n rows (where m and n are matrix dimensions) containing:
All row_data columns (with "row." prefix if name conflicts exist)
All col_data columns (with "col." prefix if name conflicts exist)
A "value" column containing the matrix values
Details
The conversion always processes the entire matrix regardless of which component is active. If column names conflict between row_data and col_data, all row metadata columns are prefixed with "row." and all column metadata columns are prefixed with "col." to avoid ambiguity.
Matrix values are unwrapped in column-major order (R's default), meaning all values from column 1, then all values from column 2, etc.
Examples
# Basic conversion to long format
mat <- matrix(1:12, nrow = 4, ncol = 3)
row_data <- data.frame(
gene_id = paste0("Gene", 1:4),
gene_type = c("A", "A", "B", "B")
)
col_data <- data.frame(
sample_id = paste0("Sample", 1:3),
condition = c("Control", "Treatment", "Control")
)
tm <- tidymatrix(mat, row_data, col_data)
long <- to_long(tm)
head(long)
#> # A tibble: 6 × 5
#> gene_id gene_type sample_id condition value
#> <chr> <chr> <chr> <chr> <int>
#> 1 Gene1 A Sample1 Control 1
#> 2 Gene2 A Sample1 Control 2
#> 3 Gene3 B Sample1 Control 3
#> 4 Gene4 B Sample1 Control 4
#> 5 Gene1 A Sample2 Treatment 5
#> 6 Gene2 A Sample2 Treatment 6
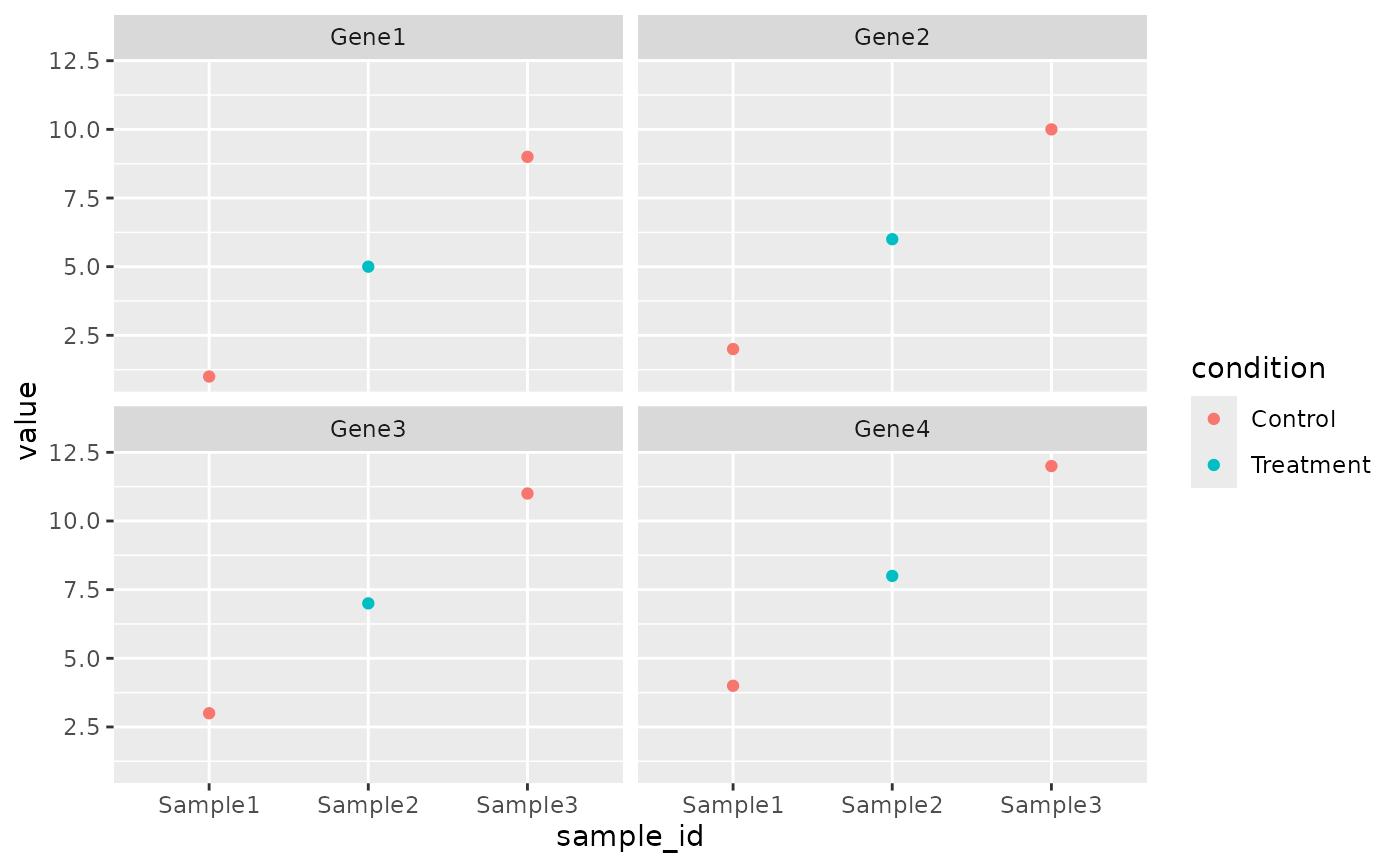
# Use in ggplot2 workflow
if (requireNamespace("ggplot2", quietly = TRUE)) {
library(ggplot2)
tm |>
to_long() |>
ggplot(aes(x = sample_id, y = value, color = condition)) +
geom_point() +
facet_wrap(~gene_id)
}
 # Statistics added to the metadata carry over to the long format
big5 <- tidymatrix(big5_responses, big5_respondents, big5_items) |>
activate(columns) |>
compute_ttest(
group_col = "gender", control = "Female", treatment = "Male",
add_to_data = TRUE
)
long_big5 <- to_long(big5)
head(long_big5[long_big5$p.adj < 0.05, ])
#> # A tibble: 6 × 17
#> respondent_id age gender education occupation country life_satisfaction
#> <chr> <int> <chr> <fct> <chr> <chr> <int>
#> 1 R001 52 Female Secondary Service/Manual EE 8
#> 2 R002 32 Female Master Office FI 4
#> 3 R003 66 Male Bachelor Office EE 6
#> 4 R004 42 Male Bachelor Professional EE 9
#> 5 R005 48 Female Secondary Office FI 8
#> 6 R006 62 Female Basic Service/Manual EE 4
#> # ℹ 10 more variables: completion_min <dbl>, item_id <chr>, trait <chr>,
#> # reversed <lgl>, item_text <chr>, position <int>, p.value <dbl>,
#> # log2fc <dbl>, p.adj <dbl>, value <int>
# Statistics added to the metadata carry over to the long format
big5 <- tidymatrix(big5_responses, big5_respondents, big5_items) |>
activate(columns) |>
compute_ttest(
group_col = "gender", control = "Female", treatment = "Male",
add_to_data = TRUE
)
long_big5 <- to_long(big5)
head(long_big5[long_big5$p.adj < 0.05, ])
#> # A tibble: 6 × 17
#> respondent_id age gender education occupation country life_satisfaction
#> <chr> <int> <chr> <fct> <chr> <chr> <int>
#> 1 R001 52 Female Secondary Service/Manual EE 8
#> 2 R002 32 Female Master Office FI 4
#> 3 R003 66 Male Bachelor Office EE 6
#> 4 R004 42 Male Bachelor Professional EE 9
#> 5 R005 48 Female Secondary Office FI 8
#> 6 R006 62 Female Basic Service/Manual EE 4
#> # ℹ 10 more variables: completion_min <dbl>, item_id <chr>, trait <chr>,
#> # reversed <lgl>, item_text <chr>, position <int>, p.value <dbl>,
#> # log2fc <dbl>, p.adj <dbl>, value <int>